News
Welcome to the Polynesian Girl Wine blog, where we will be highlighting events and news from around the winery…
The Palate Wheel
by Liz Thach, MW and Bus 305W Researchers, Sonoma State University
April 20, 2018
Think back to the time when you first started tasting wine. Where were you? Who were you with, and more importantly, what types of wine did you prefer? There is plenty of research confirming that consumers have different wine preferences based on their genetics, with hyper-sensitive tasters preferring sweeter and less tannic wines, and tolerant wine consumers craving larger tannins and higher alcohol wine (see Hanni & Utermohlen). However, there is also a long-held belief in the wine industry that as consumers age, their taste preferences change over time. Is this really true? A new research study was conducted at Sonoma State University to explore this topic, which is important to winemakers and marketers alike as they strive to ensure that the wine they produce continues to be desired by consumers.
Introducing the Wine Palate Life Cycle Wheel
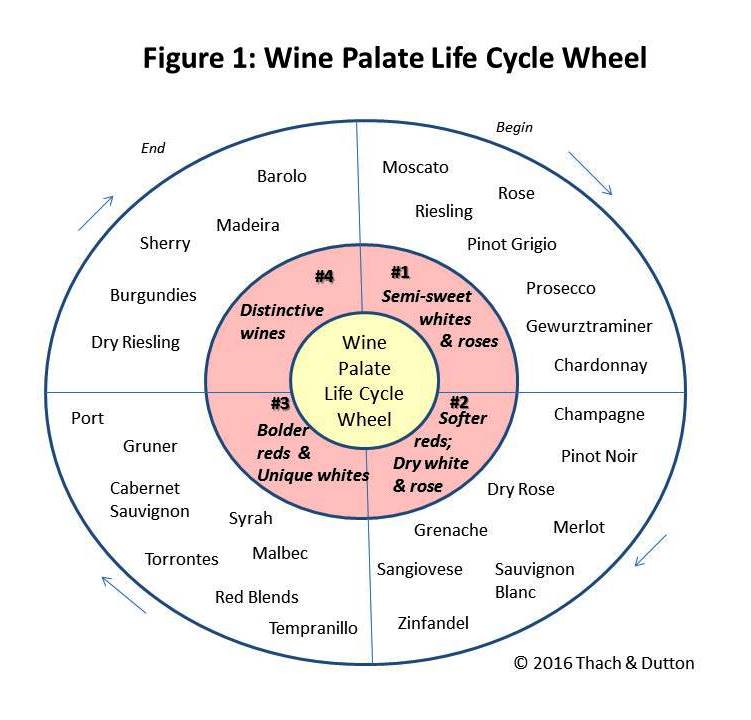
One way of illustrating this “supposed shift in preference over time” is by examining the Wine Palate Life Cycle Wheel (Figure 1). This is a model designed to portray the palate journey of many wine consumers, and includes four phases of taste migration. Phase one usually begins with a preference for semi-sweet white and rose wines, and phase two is a graduation to softer reds and dry white and rose wines. Phase three includes a growing preference for bolder, more tannic reds and unique white varietals; whereas phase four is a craving for distinctive wine styles, such as earthy Barolos and Burgundies, petrol-laced dry Riesling, and/or nutty Sherry and Madeira. However the Wine Palate Life Cycle Wheel is just a model, with little scientific proof to justify its four phases.
Research Methodology
In order to see if the Wine Palate life Cycle Wheel has any credence and to delve deeper in the long-held belief that wine consumer tastes change over time, a research study was conducted in the Spring of 2018 at Sonoma State University’s Wine Business Institute. An online survey was developed, and distributed to a convenience sample of wine consumers. A total of 422 surveys were completed with the following demographics: 28% male/72% female; 48% college graduates, with 82% living in California. In terms of age, 27% of the sample were Baby Boomers or older, 15% were Gen Xers; 30% Millennials, and 28% iGeneration (aged 21 or 22).
Have Your Wine Preferences Changed Over Time?
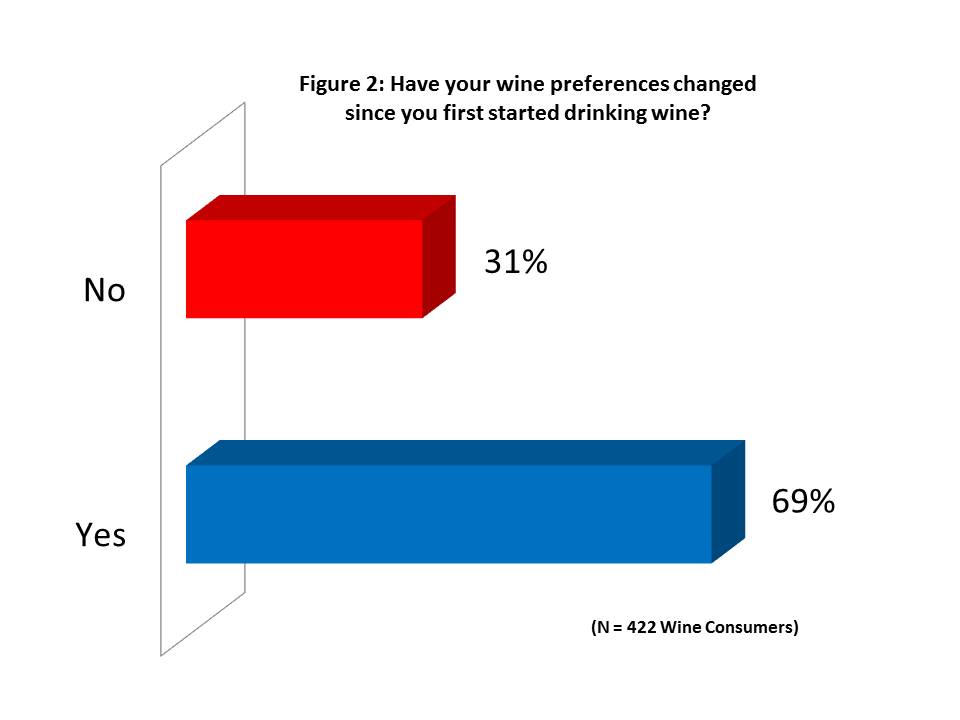
One of the major questions in the survey was: “Have your wine preferences changed since you first started drinking wine?” The results shows that 69% of the sample stated their wine preferences did change over time, whereas 31% of the sample reported no change (Figure 2).
It should be noted that since 28% of the sample were iGeneration, aged 21 to 22, an ANOVA was used to see if there was any statistical significance between generations. However, none was found. Younger wine consumers were just as apt to report that their tastes had changed over time as older wine consumers. There were also no significant differences based on gender, meaning both men and women were equally apt to report that their preferences had changed.
How Have Your Wine Preferences Changed?
Consumers who confirmed that their wine preferences had changed since they first started drinking were then asked the following two questions: 1) “Which of the following types of wine did you PRIMARILY begin drinking?” and 2) “Which wine style do you PRIMARILY prefer to drink now?” Possible responses were: Semi-sweet or sweet white wines, dry white wines, Semi-sweet or sweet rose wines, dry rose wines, Semi-sweet or sweet red wines, dry red wines.
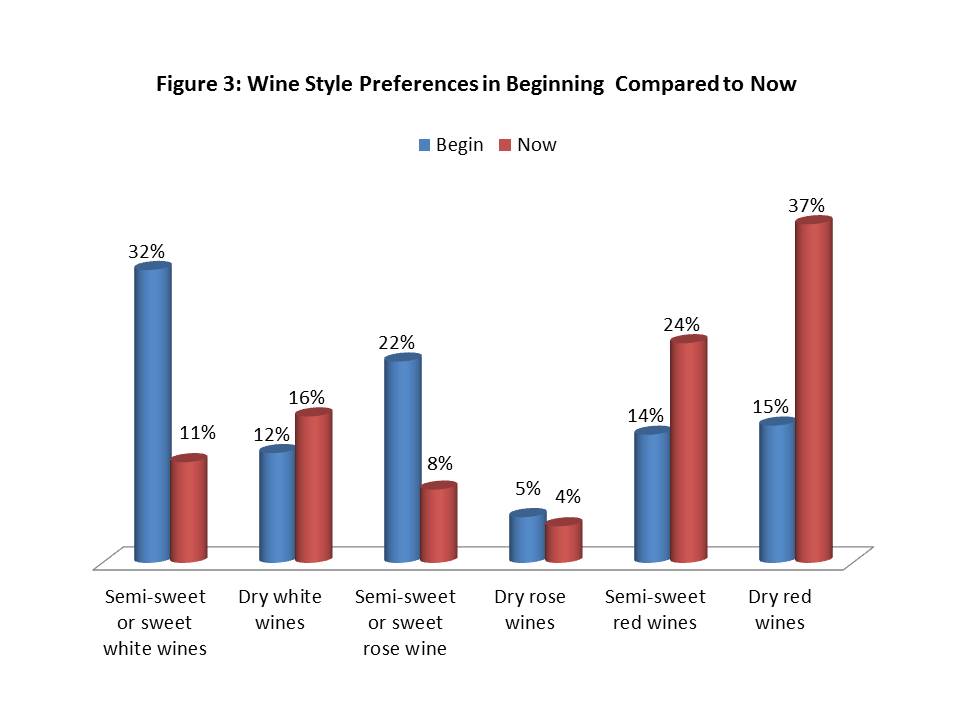
The results (Figure 3) show a clear difference in several categories. Semi-sweet or sweet wine wines decreased from a 32% preference when beginning to drink wine to 11% preference now. Likewise, semi-sweet or sweet rose wines declined from 22% to 8%. The largest change was a preference in dry red wine, which started at 15% in the beginning and increased to 37% now. A surprising result was a growing preference for semi-sweet red wine, growing from 14% in the beginning to 24% now. This is most likely due to the growing category of slightly sweet red blends in the US market.
Those Who Said “NO”
But what about those consumers who reported no change in wine preferences? When analyzing the data, another surprising result occurred. A statistically significant percentage of the “no change” consumers reported a strong preference for sweet and semi-sweet wines. This indicates that some consumers with a hyper-sensitive palate do not change their wine preferences over time, and always prefer sweeter wines.
Implications for Wine Marketers
These results support the premise illustrated in the Wine Palate Life Cycle Wheel, confirming that taste preferences do change overtime for a large portion of the wine consumer population. However, the wheel needs to be modified to include semi-sweet reds, most likely in Phase Two and Three of the cycle. Some potential implications for wine marketers are:
Provide Semi-Sweet Entry-Level Wines: make sure to offer some semi-sweet white and rose wines as an entry point for all wine consumers
Don’t Stop Producing Dessert Wines: the results show that there will always be a small group of consumers who only prefer semi-sweet and sweet wines. Therefore, a dessert wine option should always be available.
Dry Red and White Wines Prevail: in the long run, dry white and red wines are still preferred by most consumers – especially as they age.
It is Possible to Create New Wine Trends: the fact that semi-sweet red blends scored so high in consumer preferences, and were identified as a style that more people have migrated to supports the preference that new wine trends can be created. Though dry red blends have been around for centuries, semi-sweet red blends are relatively new to the US market – yet they have captured large market share in the US. The survey shows that more consumers have adopted this wine style, and this may be because it is new. Therefore wineries and wine marketers can take heart that they may be able to start the next great wine trend.
References:
Bruwer, J., Saliba, A. and Miller, B., 2011. Consumer behaviour and sensory preference differences: implications for wine product marketing. Journal of Consumer Marketing, 28(1), pp.5-18.
Hanni, T. and Utermohlen, V., 2010. Beverage Preferences, Attitudes, & Behavior of ‘Sweet’and ‘Tolerant’Wine Consumers.
Hanni, T., 2012. Why You Like the Wines You Like: Changing the Way the World Thinks about Wine. HanniCo.
by Liz Thach, MW and Bus 305W Researchers, Sonoma State University
Dr. Liz Thach, MW is the Distinguished Professor of Wine & Management at Sonoma State University in the Wine Business Institute (Liz@lizthach.com ). The research team was composed of 23 students ranging in age from 20 to 26, with an average age of 22. All are pursuing B.S. degrees in Wine Business at SSU. They include: Abajian,J., Angeja,M., Brody-Duran,A., Brown,D.,Diekmann,L., Druilhet,S., Fagan,A.,Garzon,E., Hall,A., Hampton,A., Harrison,A.,Herrera,B.,Lopez, A.,Mattos,H.,Mead,K.,Mendes,C.,Muniz Madrigal,D., Pang,D.,Simone,G.,Sogi,H.,Sussman,E.,Vielma-Cortes,K. and Wagner-Taylor,A.
Permission granted to Polynesian Girl on 4/21/2018 by Dr. Liz Thatch, MW to share with our customers. Thank You Liz!